I Analysed Every Corner from the A-League (So Far). Here Are The Results
So, I’ve been learning how to use Tableau for the last couple of days. I took this Udemy course from Stuart Reid (his Twitter/X) which I highly recommend.
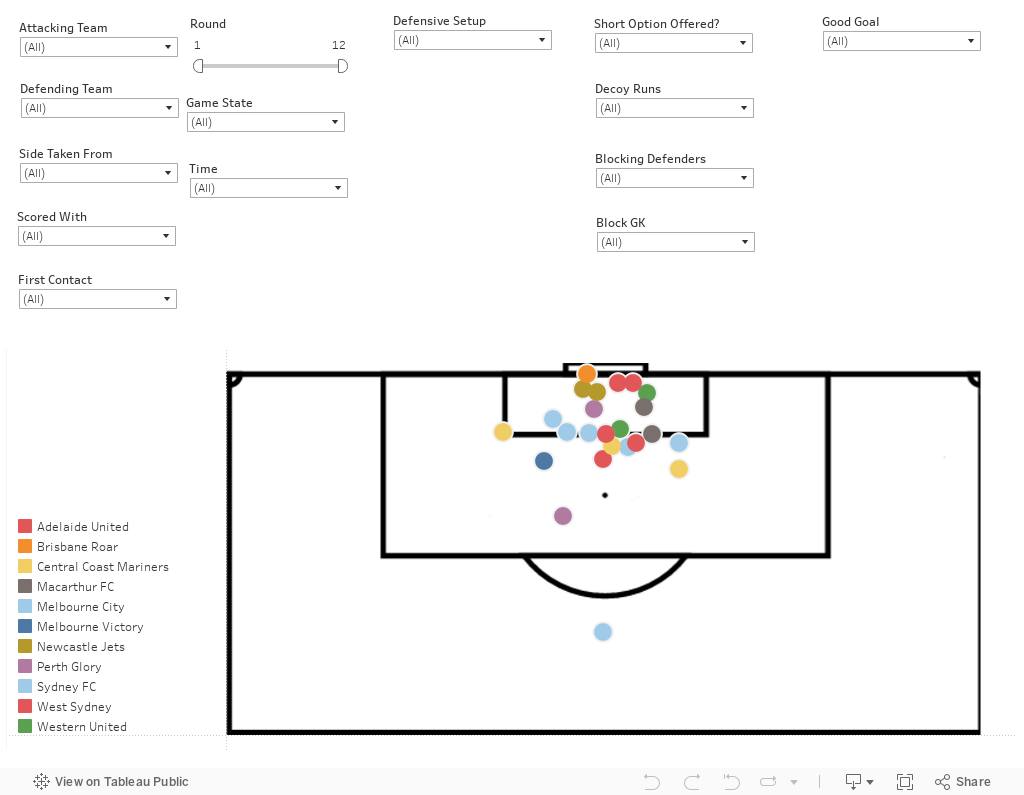
To get better at it and to do some analysis of goals in the A-League, I looked at all the goals from corners so far this season. I have also created a tool that you can use to look at the results and try and find any trends.
I Don’t Care About the Takeaways or Explanations – I Want to Play With the Tool
If you just want to jump straight in and have a play around, you can do that here.
Let me know if anything isn’t working, or can be improved.
Key Takeaways
- Most Effective Attacking Teams: Sydney FC leads with 4 goals from corners, followed by West Sydney, Melbourne City, and Central Coast Mariners with 3 goals each.
- Most Vulnerable Defending Teams: Western United has conceded the most with 9 goals from corners, significantly higher than the next teams, Newcastle Jets and Brisbane Road, with 3 goals each.
- Common Delivery Areas for Successful Corners: The most common delivery areas for successful corners are the Front Post and Central Area, each with 7 goals, followed by the Back Post with 6 goals.
- Impact of Game State on Corner Success: Teams trailing by one goal (-1) have scored the most from corners (7 goals), suggesting a possible increase in urgency or change in tactics when behind. Goals are also commonly scored when the game is tied at 0-0, with 5 goals scored in this state.
- Strategies Used and Their Effectiveness: The majority of corners did not involve a short option, decoy runs, or crowding the 6-yard box. However, when these strategies were employed, they resulted in goals 11, 5, and 6 times respectively. Blocking the goalkeeper and defenders seems to be a less common strategy but has been used effectively in some instances.
- Timing of Goals: The timing of goals is evenly distributed at the beginning and the end of the match with 7 goals scored both in the early minutes (0-15) and late in the match (76-90). The mid-sections of both halves saw fewer goals, with 3 goals each in the early second half (46-60) and mid-second half (61-75), and only 2 in the late first half (31-45).
Playing Against Different Types of Defensive Setups
- Against Full Zone Defense:
- Type of Delivery: Outswinging corners have been the most successful against a full zone defense, accounting for 5 goals, followed by inswinging corners with 3 goals.
- Tactics: Short corners have been used effectively 5 times against full zone defenses. Consider using short corners to disrupt the zonal marking and create more dynamic angles of attack.
- First Contact: Goals against full zone often come from the initial contact, suggesting that a well-placed delivery that targets the attackers’ strong heading ability can be effective.
- Against 2 Front 1 Middle Setup:
- Type of Delivery: There’s a mix of short, chipped, inswinging, and outswinging deliveries, indicating flexibility in approach.
- Tactics: Short corners and placing a player on the goalkeeper (Block GK) seem effective, having been used 3 times each. Creating confusion and drawing defenders out of position could be key.
- First Contact: Goals come from both assists (headers or foot) and direct shots, implying that the second phase of play after the corner is also crucial.
- Against 1 Middle 1 Front 1 Back Setup:
- Type of Delivery: Inswinging and outswinging corners have been equally effective.
- Tactics: Crowding the 6-yard box has been a part of the tactic on 3 occasions, suggesting that overloading this area can lead to scoring opportunities.
- First Contact: Goals and shots have come from the initial contact, indicating that direct threats are successful.
- Against 3 Front 1 Middle Setup:
- Type of Delivery: Outswinging corners are more successful, leading to 2 goals.
- First Contact: Assists through headers are common, which means the attacking team should focus on delivering the ball to a player who is strong in the air.
What the Filters Mean
If you’re looking at those filters and have no idea what’s going on, I’ve explained a few of them below.

Ways to Make this Better
A few strategies to improve separated into very do-able (green), would be good (yellow), and would be great but CBF, or might not be worth the effort (red).
Keep updating the sheet after every round
Add in other ways to visualise the data
Double check and make sure I haven’t missed any goals
Add in chances from corners (find a way to view them?)
More options for defensive setups
Keep the sheet over seasons
Generally get better at this and make adjustments as I go
Eventually do free kicks too
Add a video of each goal so it links out to it (that seems like a LOT of work, not to mention I don’t have access to the videos)
Add in all corners